Datadog is hard to replace because it is not a metrics tool; it is host and container monitoring, logs, traces, dashboards, alerting, service maps, synthetics, and a large integration catalog behind one data model. The first real choice is whether you want one open source platform that covers most of that surface, or a composed stack with separate systems for metrics, logs, and traces. A composed stack gives sharper control over retention and cost, but correlation, permissions, upgrades, and on-call ownership all become your responsibility.
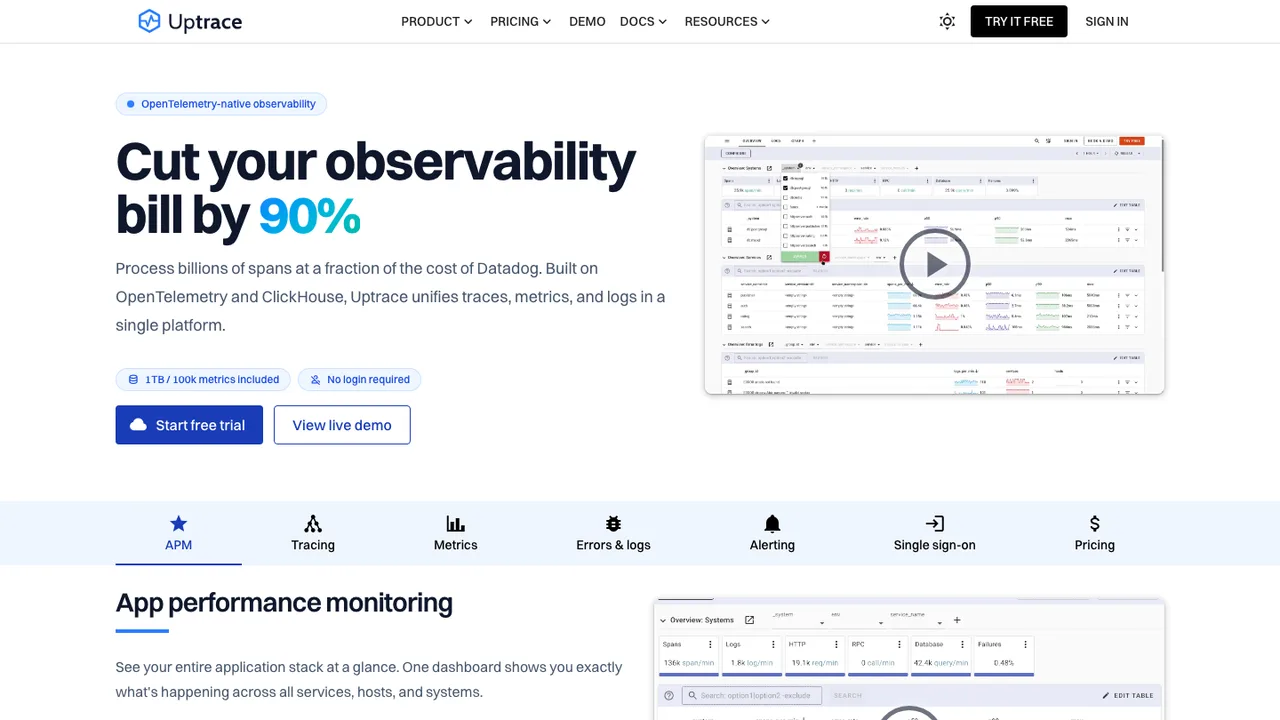
Where open source usually lags is the glue rather than the core telemetry: tag conventions, saved views, monitor evaluation, alert routing, and integration defaults that teams stopped noticing. The collection paths themselves are in good shape, especially if you standardize on OpenTelemetry. SigNoz and Uptrace are built OpenTelemetry-native and put traces, metrics, and logs in one interface, so they land closest to Datadog's single-pane feel. Coroot takes a different route, using eBPF to collect metrics, logs, traces, and profiles with no code changes, which helps for legacy services you cannot easily instrument. Budget time to retrain engineers on new query languages and to rebuild runbooks tied to Datadog screens.
Cut over as a dual-write period, not a flag day. Inventory Datadog monitors, dashboards, metric names, tag keys, log pipelines, trace instrumentation, and SLOs, then move collection toward vendor-neutral agents and send the same telemetry to both systems until alert behavior matches. Dashboards and monitors often export as JSON through the API or infrastructure-as-code state, but the queries need translation. Historical logs and metrics depend on retention and archives, so treat old data as reference you can read, not something that will rehydrate cleanly into the new backend.