PRTG makes one logical check feel like a single unit of licensing, alerting, and dashboarding, so the first task is deciding what your real source of truth is: SNMP polling, agent metrics, flow data, Windows counters, HTTP checks, or synthetic transactions. Teams that skip this step tend to carry over hundreds of tiny auto-discovered sensors that never mattered. Treat the move as a monitoring design review, and decide up front how distributed sites will be collected, because PRTG's remote-probe pattern has no single universal equivalent.
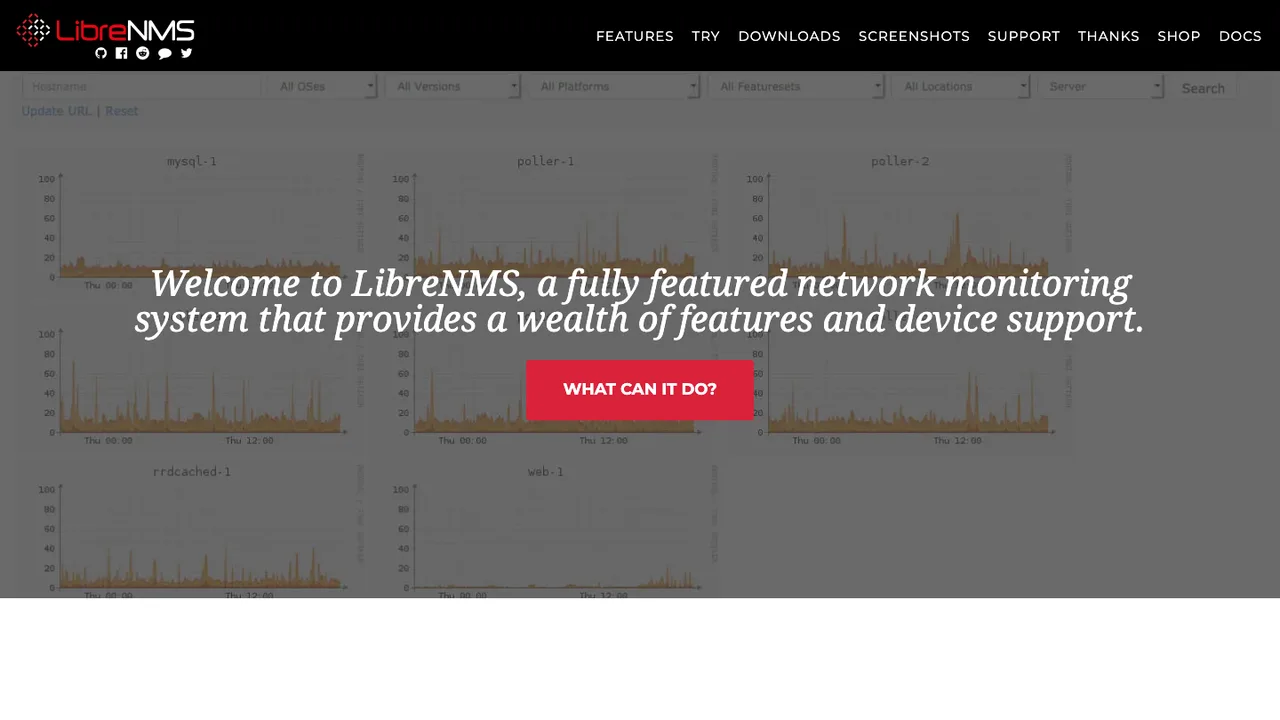
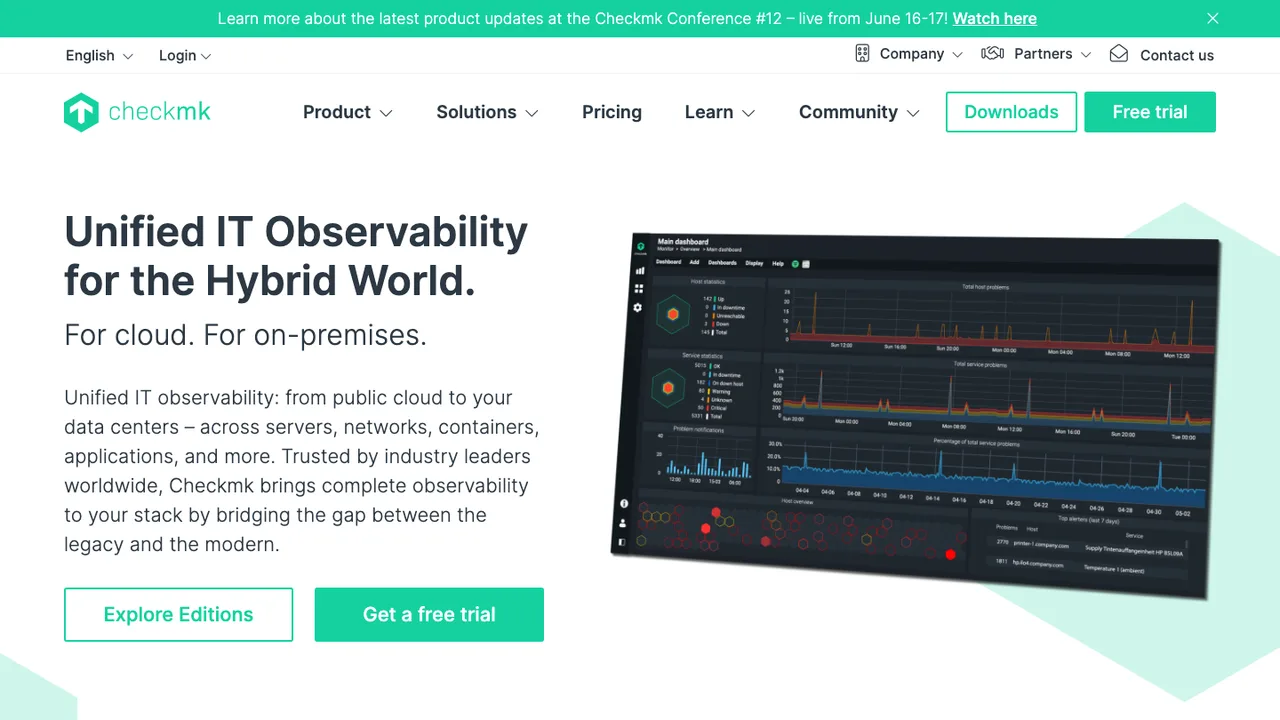
Expect to give up some of the convenience that came from having discovery, device templates, dependencies, and map editing wired together in one product. In open source, those often become separate responsibilities: a collector, time-series storage, an alerting engine, and a visualization layer. That split scales well but changes ownership, since someone now defines labels, retention, and notification routing. LibreNMS comes closest to PRTG's hands-off feel, autodiscovering and fingerprinting gear over SNMP, while Checkmk leans on hundreds of bundled plugins so onboarding a host is mostly installing an agent. Icinga and Nagios Core instead reward teams who want checks defined explicitly as configuration.
Migration is inventory and rebuild, not import. Use PRTG's API and export views to pull groups, devices, sensors, channels, thresholds, and notification triggers, and export historical graphs where you need baselines. Alert semantics, dependencies, maps, and custom sensors have to be translated by hand, and credentials should be recreated in the new system rather than copied around. Stand up collectors beside the existing probes, compare alert noise for at least one maintenance cycle, then cut over one site or service class at a time instead of all at once.