
OpenTelemetry-native APM for traces, metrics, and logs with self-hosted and cloud options
- Stars4.2k
- Forks210
- Open Issues39
AGPL-3.0
- Go
- Vue
- TypeScript
About Uptrace
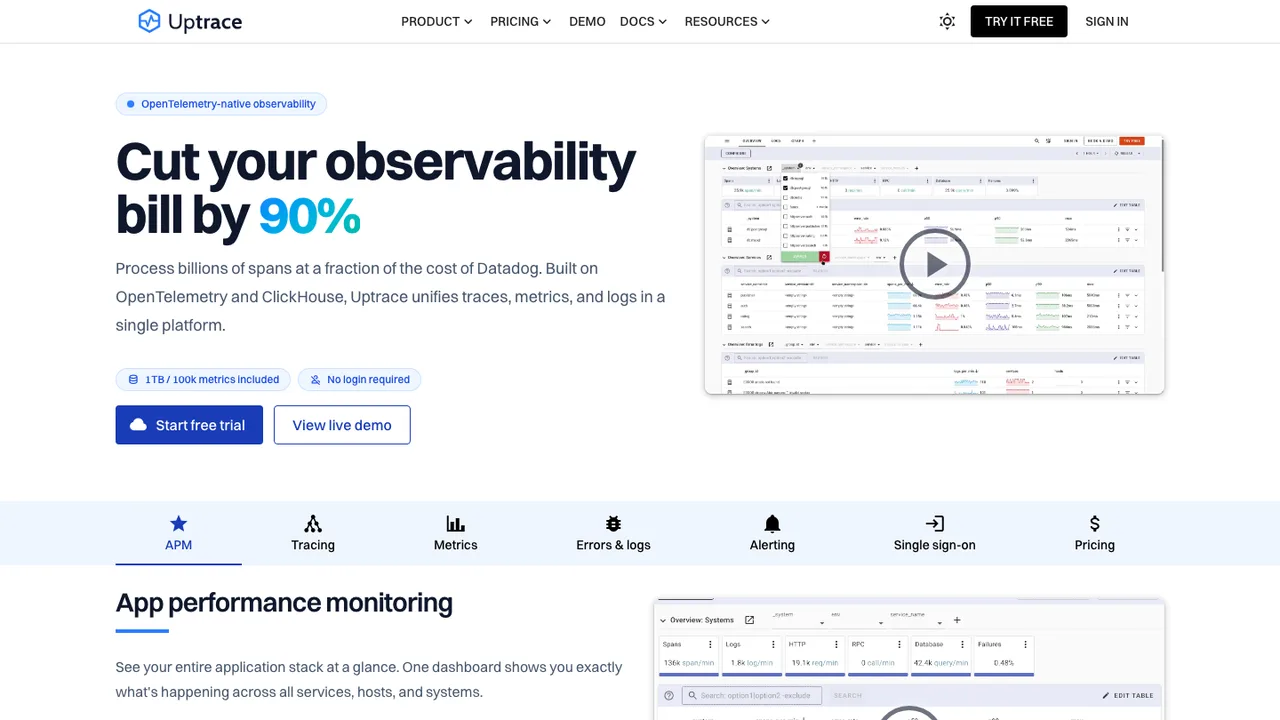
Uptrace is an open source APM for monitoring applications and troubleshooting issues with OpenTelemetry traces, metrics, and logs. It is built for teams that want a single place to follow application behavior across telemetry data.
It includes a query builder, rich dashboards, alerting rules, notifications, service graphs, and chart annotations. It supports SQL-like span queries, Promql-like metric queries, and ingestion from OpenTelemetry, Prometheus, Vector, FluentBit, and CloudWatch. It is also compatible with Grafana as a Tempo or Prometheus datasource.
Uptrace uses ClickHouse for stored telemetry and PostgreSQL for metadata such as metric names and alerts. It can be run locally with Docker, and it also offers a cloud demo and Uptrace Cloud. Users and projects can be managed via YAML config, and SSO works with OpenID Connect providers including Keycloak, Google Cloud, and Cloudflare.
Key features
- Single UI for traces, metrics, and logs
- 50+ pre-built dashboards
- Alerting with Email, Slack, WebHook, and AlertManager
- SQL-like span queries and Promql-like metric queries
- Grafana compatibility as Tempo or Prometheus datasource
Details
- First released
- 2021
- Deployment
- self-hostable · docker · cloud
- Storage
- ClickHouse · PostgreSQL
- Telemetry
- OpenTelemetry traces, metrics, logs
- SSO
- OpenID Connect
- License
- AGPL-3.0