Ingesting logs is the easy part. The hard part is reproducing the Splunk behaviors your teams lean on every day: SPL searches, saved reports, alert timing, field extraction, sourcetype conventions, index retention, and role-based access, all of which sit behind Splunk's single product boundary. Open source replacements usually split collection, storage, parsing, search, dashboards, and alerting into separate services. That can ease license pressure and improve control, but it moves the design work onto your team.
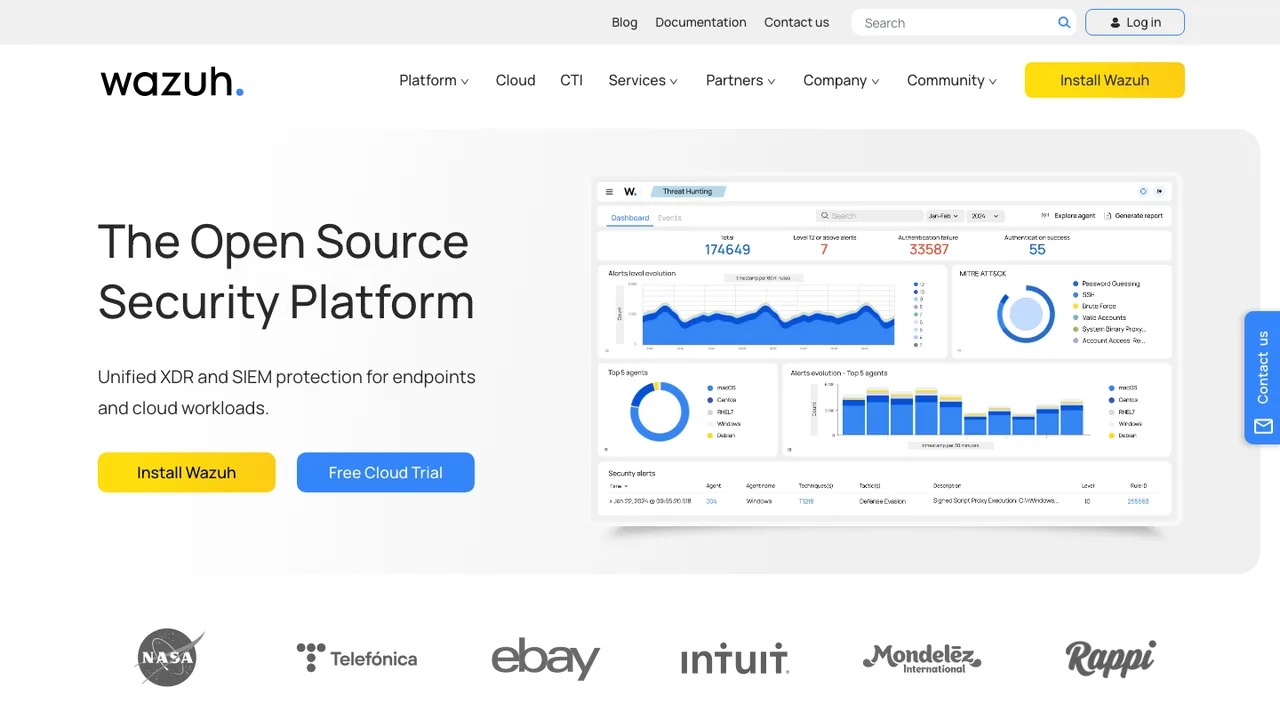
Splunk also tends to be two products at once: an operations log platform and a security analytics system, and the open source answer differs for each. For general log management and search, Graylog centralizes collection over GELF, Syslog, and Kafka, while OpenObserve stores logs in S3-backed columnar files so high volume stays affordable. For the security side, Wazuh pairs endpoint agents with rule-based analysis, file integrity monitoring, and vulnerability detection, and Sagan reuses Snort and Suricata rule syntax so existing detection workflows carry over. Heavier SPL using transactions, lookups, macros, or accelerated data models usually needs redesign, not translation, so expect to rebuild dashboards and alerts rather than import them.
Inventory knowledge objects before touching pipelines. Export saved searches, dashboards, alerts, field extractions, lookups, indexes, sourcetypes, users, and retention settings, then decide which are still worth keeping. Historical event export is possible, but moving every old event is often slower and less useful than keeping Splunk read-only through a retention window. Repoint forwarders or collectors gradually, validate parsing and timestamps source by source, and run both systems until alert volume, query results, and retention behavior line up.