Inventory the business logic before the visuals. Published data sources, calculated fields, parameters, row-level security rules, extracts, and scheduled refreshes are the parts of Tableau that actually carry meaning, and the replacement decision turns on where that logic should live. If Tableau quietly became the place where metrics are defined, you need a governed metric layer or a disciplined warehouse model to hold it. If it mostly sits on clean warehouse tables, the switch is more about dashboard authoring, permissions, and refresh orchestration than about semantics.
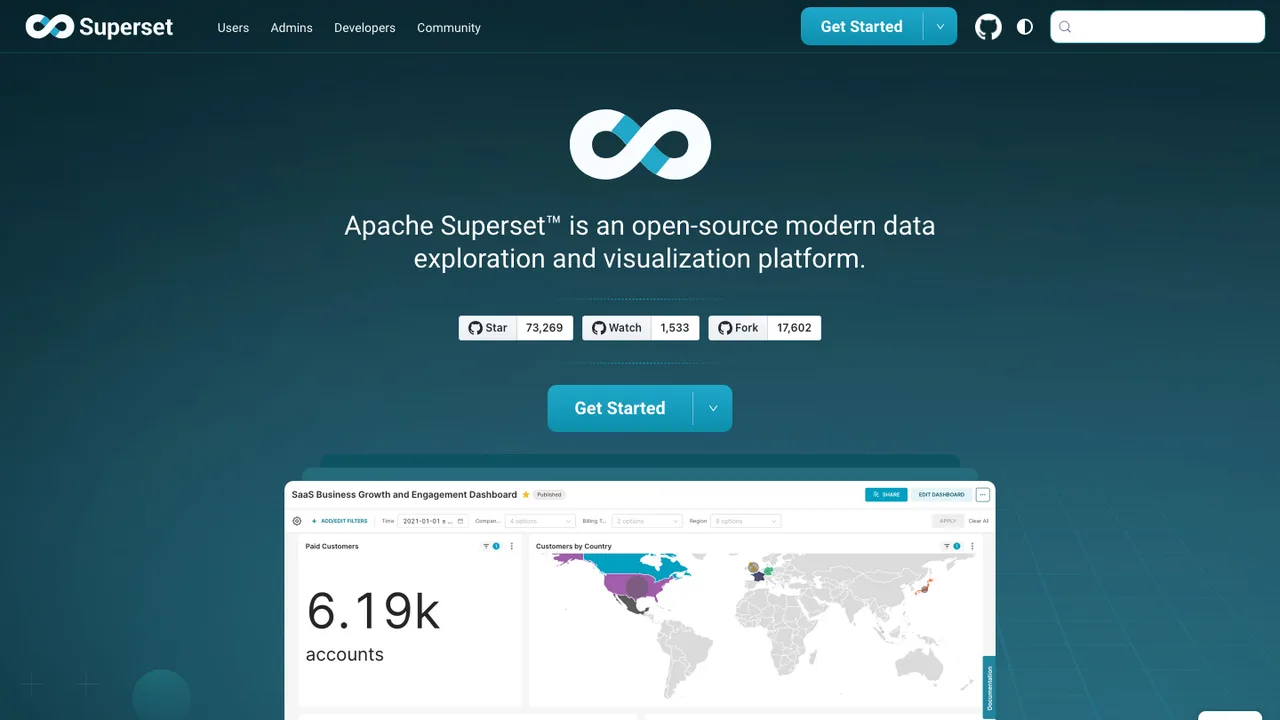
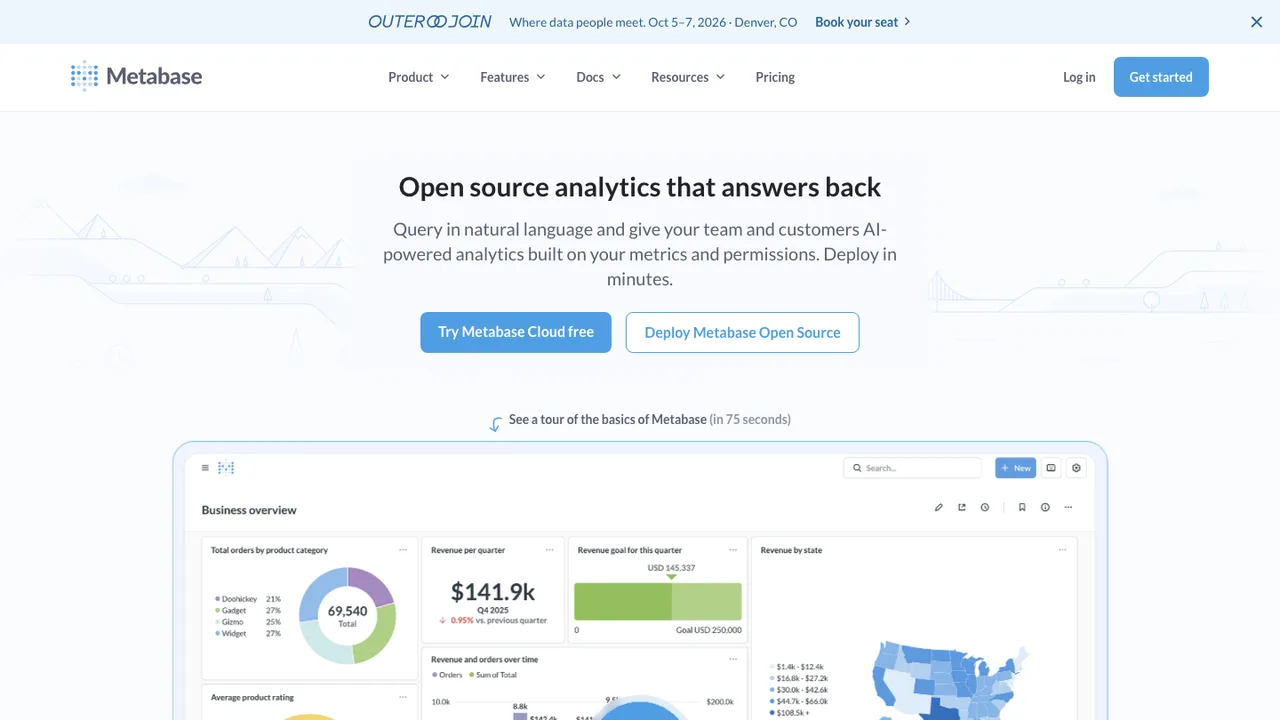
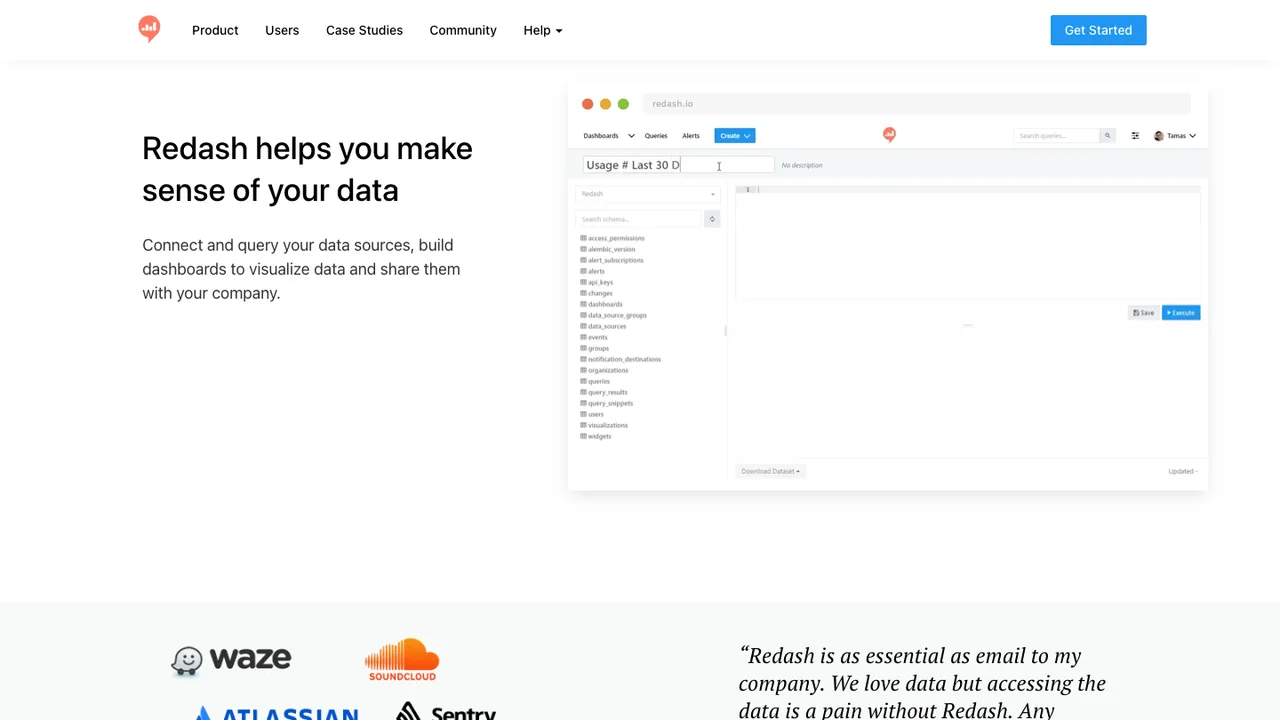
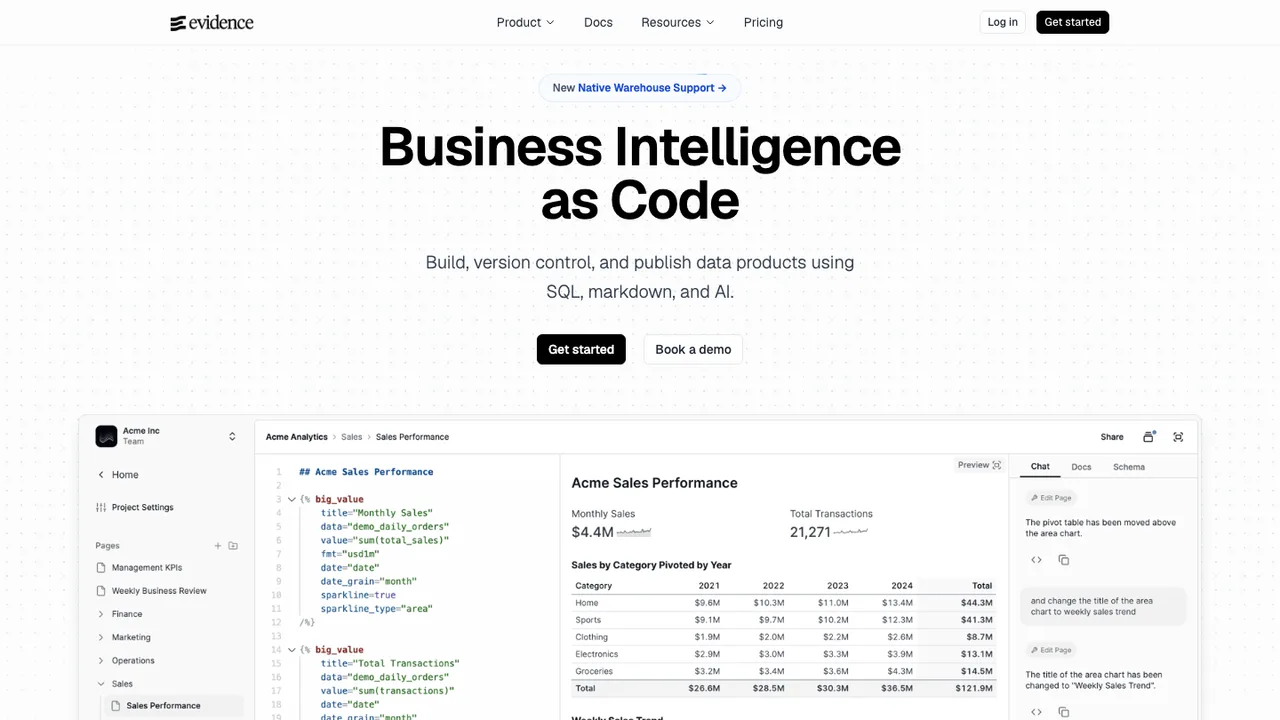
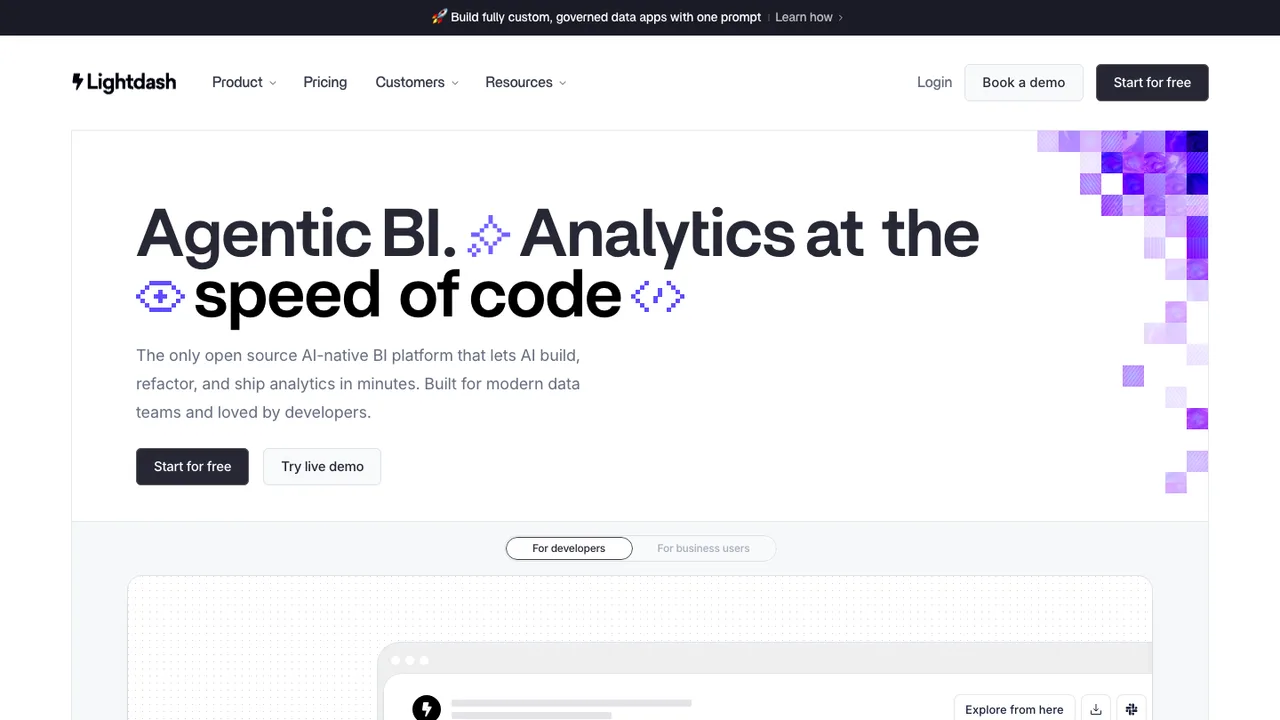
Expect gaps around polish and authoring. Tableau's fast drag-and-drop exploration and packaged workbook sharing are mature, and open source tools ask you to choose a lane instead. Metabase leans toward business users with a visual query builder that needs no SQL, while Apache Superset adds a SQL editor and a lightweight semantic layer over any SQL-speaking datastore. Evidence goes fully code-first, generating dashboards from SQL and markdown you keep in version control, and Lightdash suits dbt teams by defining metrics once in YAML alongside their models. Retrain authors, standardize chart patterns, and decide how much freedom business users should have before you migrate.
Migration is mostly rebuild, not conversion. Download workbooks and data sources, then use the .twb XML, packaged .twbx files, and admin views to inventory fields, calculations, filters, owners, and schedules. Source database connections survive conceptually, but credentials, extracts, permissions, subscriptions, and embedded links have to be recreated. Copy calculated fields as specifications and rewrite them in SQL or the new tool's expression language, watching level-of-detail and table-calculation logic where evaluation order differs. Validate rebuilt dashboards against Tableau's numbers for the same dates and filters before retiring the originals.