3 Best Open Source Alternatives to Amplitude

Updated July 2026

Amplitude built a deep product-analytics platform around one idea - track what users do, then slice it into funnels, paths, and retention to see where a product wins or loses people. For teams running on behavioral data it is a serious tool. What sends people looking is ownership: the events that describe your users live inside Amplitude, governed by its pricing tiers and its definition of an active user, and pulling that history back out to analyze it your own way is never as clean as sending it in.

The open source alternative class below gives you the same behavioral analytics over data you hold yourself. User actions land in your own store, where funnels and cohorts are computed from the raw events rather than a vendor's rolled-up summary. You decide retention, you query the history directly, and the analysis answers to you instead of a plan limit.

Umami logo

1.Umami

37.2kMITTypeScript Self-host
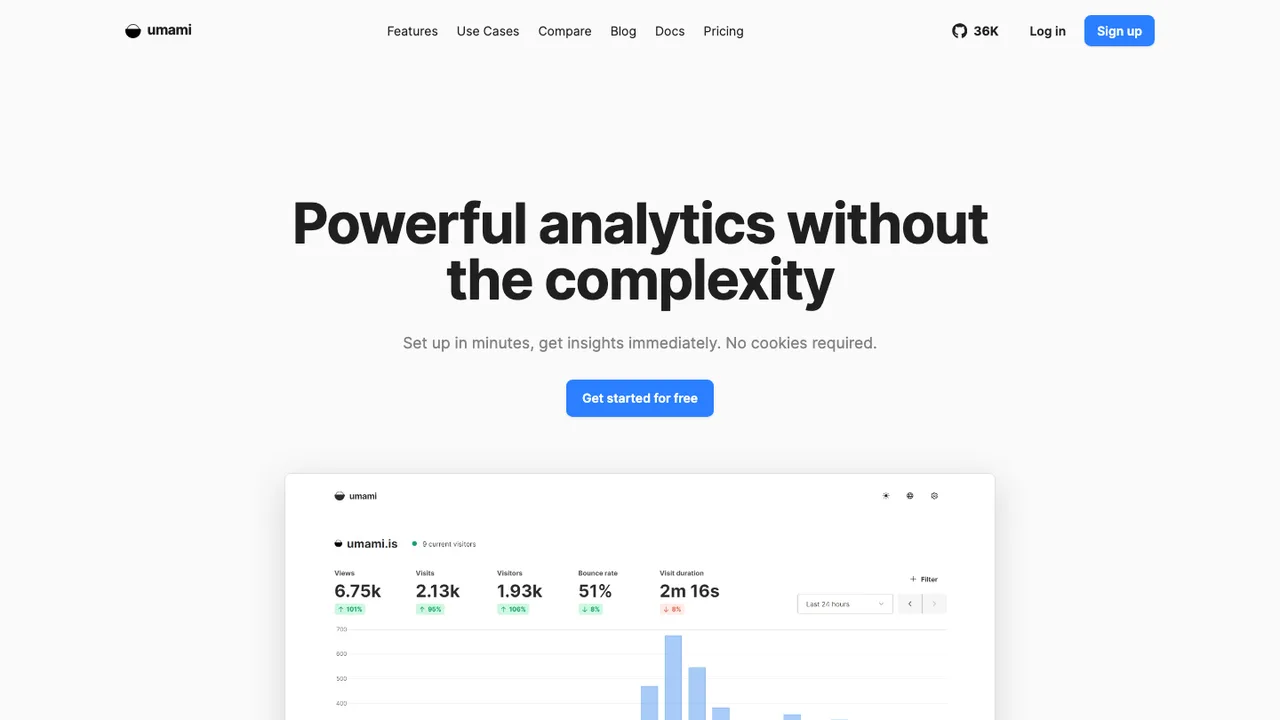
Umami screenshot

Umami is a simple, fast, privacy-focused web analytics platform and an open source alternative to Google Analytics, Mixpanel, and Amplitude. It tracks site traffic without cookies, so there is no cookie banner to add, and the dashboard stays clean and easy to read.

  • Cookie-free web analytics with no consent banner
  • Simple, fast single-page dashboard
  • Self-hosted or Umami Cloud
  • Runs on Node.js with a PostgreSQL database
PostHog logo

2.PostHog

35kOtherPython Self-host
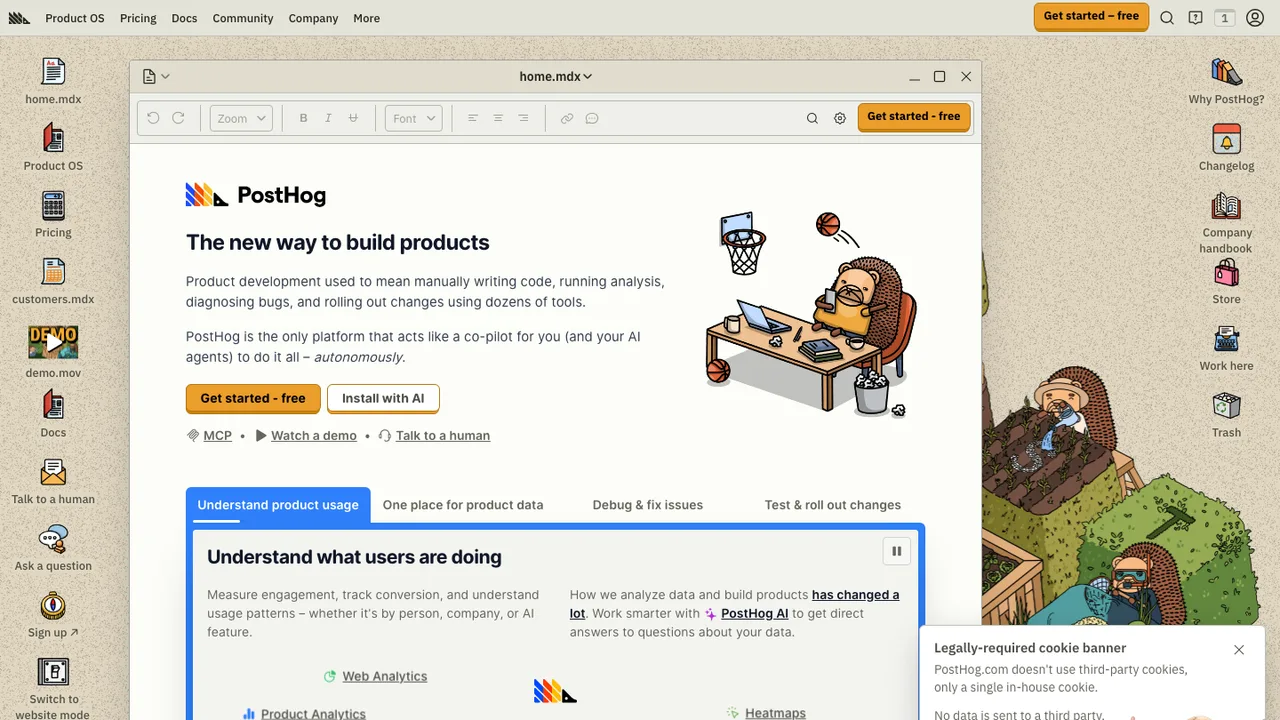
PostHog screenshot

PostHog is an open source, all-in-one platform for building products. It brings product analytics, web analytics, session replay, error tracking, feature flags, experiments, surveys, a data warehouse, data pipelines, AI observability, and workflows together in one stack.

  • Autocapture or manually instrument event-based product analytics
  • Web analytics for traffic, sessions, conversion, web vitals, and revenue
  • Session replay and error tracking with alerts
  • Feature flags, cohorts, experiments, and no-code experiment setup
Countly logo

3.Countly

5.9kOtherJavaScript Self-host
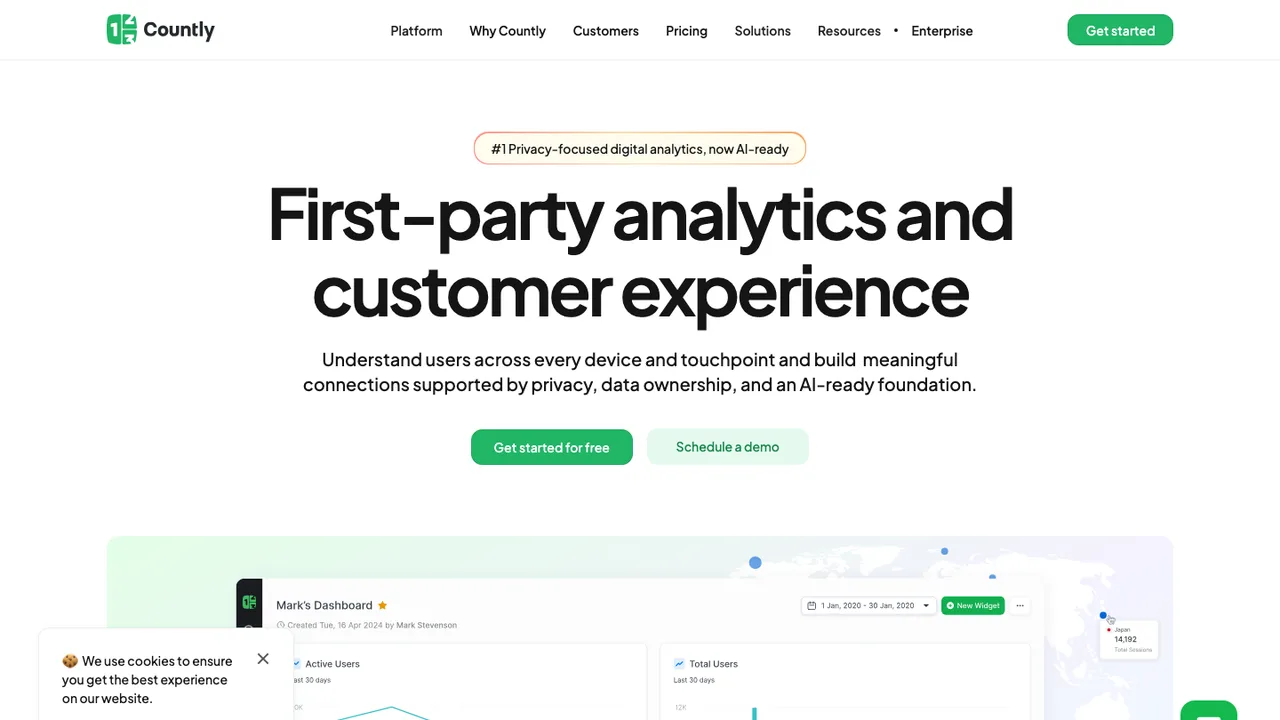
Countly screenshot

Countly is a digital analytics and customer engagement platform for understanding user behavior across mobile, web, desktop, and connected devices. It keeps data on infrastructure you control, with on-premises or private-cloud deployment for teams that need full data ownership.

  • Session, view, event, and crash or error collection
  • Push notifications for iOS and Android
  • Remote configuration for app logic and behavior
  • Built-in reports and customizable dashboards

Switching from Amplitude to open source

Start by mapping the Amplitude behaviors your teams actually use, not the screens they recognize. The hard parts are event semantics, identity resolution, cohort definitions, funnel logic, retention windows, and governance around who can create or change metrics. Amplitude encourages deep use of its event model and UI-defined analysis, so a replacement needs to match your product questions before it matches every chart type. Also decide whether analytics should live as a standalone application, on top of your warehouse, or in a pipeline you operate directly.

Expect gaps in polish and self-serve breadth. Amplitude is built for non-SQL product exploration, fast funnel slicing, path analysis, cohort reuse, and collaboration around saved analyses. Open source replacements may require more upfront schema discipline, more engineering involvement, or separate systems for experimentation, notifications, reverse ETL, and executive reporting. Some teams accept that trade because they want raw event ownership and predictable infrastructure. Others discover that the missing piece is not charts, but the metric layer that keeps product, growth, and support teams using the same definitions.

Migration usually starts with a historical export from Amplitude, followed by a backfill into the new store and a period of dual-writing from your SDKs or event collector. Raw events, timestamps, event properties, user properties, user IDs, and device IDs can usually survive if you export them carefully. Dashboards, notebooks, chart settings, saved cohorts, and permissions are mostly application objects, so plan to recreate and validate them. The cleanup work is identity mapping, timezone handling, deduplication, renamed events, property type drift, and reconciling old funnel counts against the Amplitude baseline.

Related alternatives

Frequently asked questions

Why do teams usually replace Amplitude?+

The common reasons are event-volume cost pressure, stricter data residency needs, deeper warehouse ownership, or a desire to customize the analytics pipeline. Amplitude is convenient when product teams live inside its UI, but it can become constraining when event data needs to be governed like core business data. A good replacement decision starts with which analyses must remain self-serve and which can move closer to engineering or data teams.

Will an open source option actually reduce analytics cost?+

It can, but the savings are not automatic. You may stop paying a vendor bill tied to event volume, but you will take on storage, compute, upgrades, monitoring, backups, and staff time. The cost model improves when you already operate data infrastructure or have high event volume with predictable query patterns. If your team needs a polished product analytics UI with little engineering support, the total cost can move sideways.

Is self-hosting product analytics worth it?+

Self-hosting is worth considering when event data is sensitive, data residency is strict, or you need direct control over retention and processing. It is less attractive if your team lacks operational capacity for queues, databases, schema changes, and uptime. Product analytics systems are write-heavy and query-heavy at the same time, so the hosting decision should be based on expected event volume, cardinality, and how often teams run exploratory queries.

What data can be exported from Amplitude?+

Amplitude provides ways to export event data, including raw events with timestamps, event properties, user properties, and identifiers. What you get back is the data, not the full product experience. Derived assets such as charts, notebooks, dashboard layout, formulas, permissions, and some cohort logic usually need to be rebuilt. Before exporting, freeze a date range, document timezone assumptions, and capture baseline counts for key funnels and retention reports.

Do Amplitude dashboards and notebooks migrate automatically?+

Usually no. Dashboards and notebooks are application-level objects with chart types, filters, formulas, layout, permissions, annotations, and links to saved definitions. Even when you can document them, a new tool will have different query semantics and visualization settings. Treat migration as a metric reconstruction exercise: identify the dashboards people still use, rebuild the underlying questions, then validate counts against Amplitude before retiring the originals.

How should we handle user identity during the move?+

Identity is the place to be most careful. Amplitude analytics may combine user IDs, device IDs, and its own internal identifiers in ways that affect funnels, retention, and user counts. Export enough identifier fields to reconstruct the join rules, then decide how the new system will handle anonymous-to-known transitions. Validate with a few real user journeys, not just aggregate totals, because identity mistakes can make conversion and retention look wrong.

What happens to cohorts and behavioral segments?+

Cohorts rarely move as reusable objects. You can often export membership or recreate the logic, but the new system may define time windows, property filters, and identity differently. For important cohorts, write down the exact behavioral rules in plain language, export a sample membership list from Amplitude, and compare results after rebuilding. If cohorts feed messaging, experiments, or sales workflows, plan a parallel run before switching those downstream uses.

How painful is importing historical events?+

The pain depends on volume, property consistency, and how long your Amplitude history is. A clean export with stable event names and typed properties is straightforward to load, but years of renamed events, mixed timestamp formats, and high-cardinality properties create cleanup work. Import in chunks, preserve original event IDs or dedupe keys when available, and keep a reconciliation table that compares daily event totals and core funnel counts with Amplitude.

Should we dual-write events before cutting over?+

Yes, if the analytics are business-critical. Dual-writing lets you compare the same production traffic in Amplitude and the new stack before users depend on the replacement. Keep the period long enough to cover weekly usage patterns and major product flows. Watch for missing events, different timestamps, property type mismatches, and identity drift. Once key reports reconcile within an agreed tolerance, freeze new Amplitude dashboard work and move teams over.

What changes for mobile instrumentation?+

Mobile changes usually involve SDK replacement, event queue behavior, offline buffering, app version tagging, and privacy controls. Do not swap SDKs casually across all apps at once. Start with a wrapper around analytics calls if you do not already have one, then route events to both systems during a release cycle. Confirm that background events, retries, consent flags, device identifiers, and app lifecycle events behave the same on iOS and Android.

How do integrations with a data warehouse or reverse ETL work?+

Some open source analytics tools store events in their own database, while others query a warehouse or can export events into one. Decide which system is the source of truth before migrating. If Amplitude currently feeds cohorts into marketing, sales, or support tools, you will need a replacement path for those audiences. That may be native integration, scheduled exports, API jobs, or a reverse ETL pipeline owned by the data team.

What security questions matter for an Amplitude replacement?+

Ask where raw events are stored, who can query user-level data, how secrets are handled, and whether audit logs cover dashboard access and administrative changes. Product analytics often contains emails, account IDs, URLs, search terms, and behavioral traces that become sensitive in context. For self-hosted deployments, also review patching, backup encryption, network exposure, SSO, role design, and whether you can delete or redact user data reliably.

Where do open source tools usually lag behind Amplitude?+

The biggest gaps are often polish, guided exploration, collaboration workflows, and advanced product analytics features that expect little SQL knowledge. Funnel and retention analysis may exist, but pathing, anomaly workflows, experimentation tie-ins, and stakeholder-friendly notebooks can be thinner or require extra setup. The trade is control. You may gain ownership of event data and infrastructure while accepting that product managers need more training or more help from analytics engineers.

How should permissions and team workspaces be modeled?+

Do not copy Amplitude permissions blindly. Use the migration to separate who can view user-level data, create shared metrics, edit instrumentation definitions, administer projects, and export data. Product analytics permissions are easy to underestimate because one dashboard can expose sensitive behavior across accounts. If the replacement has simpler role controls, compensate with workspace boundaries, warehouse permissions, network rules, or a review process for shared dashboards and saved queries.

What is the exit plan if the new project stalls?+

Pick a replacement that keeps events in a portable format and gives you direct access to raw data. Avoid making the new UI the only place where metric definitions live. Store event schemas, transformation code, dashboard definitions where possible, and migration notes in your own repositories. Keep regular backups and document restore tests. If the project slows down later, you want to move the data and rebuild the interface, not run another rescue export.